The difference between an average Shopify store (1.8 percent conversion rate) and a top-quartile store (3.5 percent or higher) is rarely the traffic source. It is the on-site experience. Improving conversion rate from 1.8 to 2.5 percent on a brand doing 200,000 USD monthly revenue is worth roughly 78,000 USD in incremental annual revenue with no additional traffic acquisition cost.
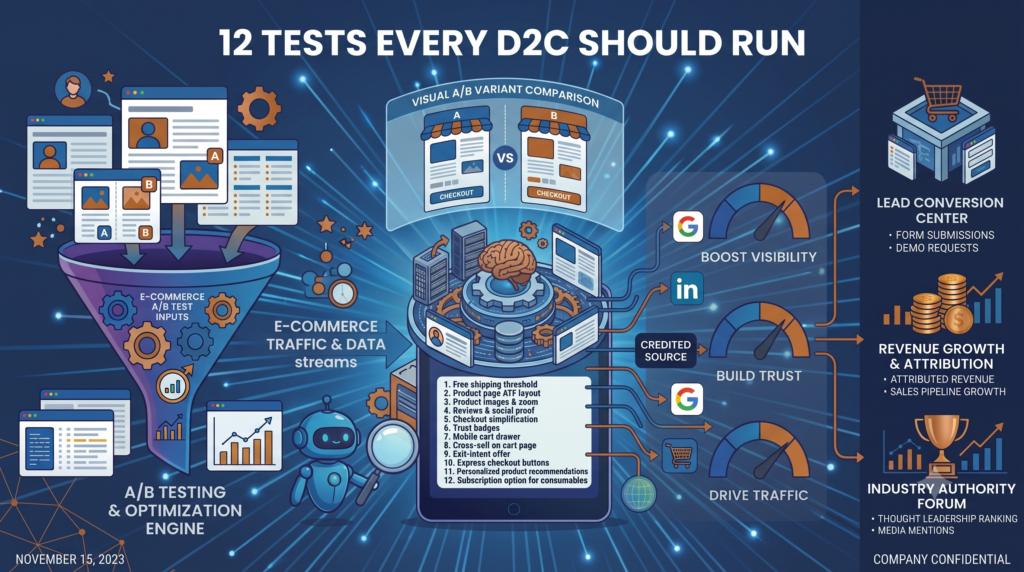
This guide covers the 12 highest-impact conversion rate tests we run across D2C client accounts in 2026. Each is backed by patterns we have seen produce lift across multiple brands.
The testing framework
Before tests, the framework. Each test needs:
Hypothesis: what specific change you are testing and what you expect to happen. “Adding trust badges next to the checkout button will increase checkout completion rate by 5 to 10 percent because trust signals reduce purchase anxiety.”
Sample size and duration. Minimum 2 weeks (cover weekly cyclicality). Minimum traffic to reach statistical significance at 95 percent confidence. For lower-traffic stores, this might be 4 to 8 weeks per test.
Primary metric. Usually conversion rate, but sometimes average order value, add-to-cart rate, or checkout completion rate depending on the test.
Secondary metrics. What else you are watching to ensure the change is not hurting elsewhere.
Test platforms in 2026: Shopify’s native checkout extensibility for checkout tests, Convert.com, VWO, or Optimizely for broader site tests. Most tests run through these tools without code deploys.
Test 1: Free shipping threshold
Hypothesis: Setting a free shipping threshold at 1.3 to 1.5x average order value increases AOV.
Implementation: Calculate current AOV. Set free shipping threshold 30 to 50 percent above that AOV. Display threshold prominently on product pages and cart (“Free shipping over X”).
Expected impact: 8 to 18 percent AOV lift, modest impact on conversion rate (slightly down due to higher AOV barrier, but revenue per visitor up).
Test design: A/B test on cart and checkout pages. Run for 4 weeks minimum.
Test 2: Product page above-the-fold layout
Hypothesis: Critical purchase decision elements (price, ADD TO CART button, key product photos, primary differentiator) should be in the first viewport on mobile.
Implementation: Audit current product page on mobile. Move price closer to product title. Ensure ADD TO CART is visible without scrolling. Prioritise the hero product image.
Expected impact: 5 to 12 percent conversion rate increase on mobile.
Test design: Mobile-only test. Two variants: current layout vs optimised above-the-fold.
Test 3: Product images and zoom functionality
Hypothesis: Multiple high-quality product images with zoom and lifestyle context increase conversion. Most stores under-invest in product photography.
Implementation: 6 to 12 images per product: hero shot, scale shot (with hand or object for size), texture close-up, in-use lifestyle, packaging, and infographic showing key features.
Expected impact: 10 to 25 percent conversion rate increase, particularly for fashion, beauty, home and electronics categories.
Test design: Add additional images to 25 percent of product catalogue. Compare conversion to control products.
Test 4: Reviews and social proof placement
Hypothesis: Reviews near the ADD TO CART button increase conversion more than reviews lower on the page.
Implementation: Show star rating and review count immediately under the product title. Add 3 to 5 review snippets next to the buy button. Keep full review section lower on page.
Expected impact: 6 to 15 percent conversion rate increase for products with strong reviews (4.3 plus stars, 50 plus reviews).
Test design: A/B test review placement on top-converting products.
Test 5: Checkout simplification
Hypothesis: Reducing form fields and steps in checkout increases completion rate.
Implementation: Audit checkout. Remove non-critical fields (Company name for B2C, optional phone, optional referral source). Combine fields where possible. Default to logical defaults (country based on IP, currency based on location).
Expected impact: 3 to 8 percent checkout completion rate increase. On a 60 percent baseline completion rate, that is 2 to 5 percentage points of recovered revenue.
Test design: Checkout funnel analysis first to identify dropoff steps. A/B test the highest-dropoff step.
Test 6: Trust badges and security signals
Hypothesis: Trust badges near payment selection reduce purchase abandonment.
Implementation: SSL certificate badge, payment provider logos (Razorpay, Stripe, PayPal), money-back guarantee badge, secure checkout label. Place near the pay button, not in the footer.
Expected impact: 2 to 8 percent checkout completion rate increase. Higher for higher-priced products and for new visitors.
Test design: Add or remove trust badges in checkout. Compare completion rates.
Test 7: Mobile-specific cart drawer
Hypothesis: Mobile users add to cart but rarely scroll to top to reach the cart. Slide-out cart drawer on mobile reduces friction.
Implementation: When user adds to cart on mobile, open a slide-out drawer showing cart summary, with prominent CHECKOUT button. Avoid full-page cart navigation.
Expected impact: 8 to 20 percent increase in checkout starts from mobile users.
Test design: Compare slide-out drawer vs full-page cart redirect on mobile traffic only.
Test 8: Cross-sell on cart page
Hypothesis: Strategically placed cross-sells on the cart page (not aggressively pushed) increase AOV without hurting completion rate.
Implementation: Show 2 to 4 complementary products on cart page. Algorithmically chosen based on cart contents (frequently bought together).
Expected impact: 5 to 15 percent AOV increase, neutral to slightly positive impact on completion rate.
Test design: A/B test cart page with and without cross-sell module.
Test 9: Exit-intent offer
Hypothesis: Users about to leave can be recovered with a targeted offer.
Implementation: Detect mouse movement toward browser close on desktop, or back button intent on mobile. Show a popup with email capture and a small discount (5 to 10 percent first-order discount in exchange for email).
Expected impact: 3 to 8 percent of exit-intent triggers convert to email signup. Of those, 10 to 25 percent purchase within 30 days. Net conversion lift typically 1 to 3 percent.
Test design: Implement exit-intent through Klaviyo, Privy or similar. Run for 30 days, measure email-attributed revenue.
Test 10: Express checkout buttons
Hypothesis: Apple Pay, Google Pay, Shop Pay buttons on product page (not just checkout) capture mobile impulse purchases.
Implementation: Add Buy Now express checkout buttons on product page below ADD TO CART. One-tap checkout for users with saved payment methods.
Expected impact: 5 to 15 percent mobile conversion rate increase. Particularly strong for repeat customers.
Test design: A/B test express checkout buttons enabled vs disabled.
Test 11: Personalised product recommendations
Hypothesis: Product recommendations based on browse history and similar customer purchases increase conversion and AOV.
Implementation: Use Shopify’s native recommendations or third-party apps (Rebuy, Klaviyo). Show recommendations on product pages, cart, and post-purchase.
Expected impact: 4 to 12 percent revenue per visitor increase across the site.
Test design: Compare site with and without recommendation engine for 30 days minimum.
Test 12: Subscription option for consumables
Hypothesis: For consumable products (skincare, supplements, coffee, pet food), offering a subscription discount alongside one-time purchase increases LTV.
Implementation: Add subscription option on product page with 10 to 20 percent discount versus one-time purchase. Pre-select subscription as the default option.
Expected impact: 15 to 35 percent of new customers select subscription. Customer LTV typically 2 to 4 times higher than one-time purchasers.
Test design: A/B test default selection (subscription vs one-time). Measure both immediate conversion and 90-day LTV.
Test prioritisation
Run tests in order of expected impact and effort. Quick wins first:
Easy wins (1 to 2 weeks each): Free shipping threshold, trust badges, checkout simplification, exit-intent popup.
Medium effort (2 to 4 weeks each): Product page layout, review placement, mobile cart drawer, express checkout buttons.
Larger investments (4 to 8 weeks each): Product photography improvements, personalised recommendations, subscription option for consumables.
Most brands can complete this full cycle of 12 tests within 6 to 9 months. Compound impact often exceeds 30 percent conversion rate improvement from the starting baseline.
Measurement and statistical significance
For statistical significance at 95 percent confidence with reasonable variance, minimum samples per variant:
Conversion rate around 2 percent: about 8,000 to 15,000 visitors per variant.
Conversion rate around 5 percent: about 4,000 to 8,000 visitors per variant.
AOV tests typically need more sample due to variance: 10,000 to 25,000 per variant.
Below these thresholds, tests are at risk of false positives or false negatives. Wait longer rather than concluding prematurely.
What does not work
Running too many tests simultaneously without traffic to support them. Each concurrent test reduces traffic available per variant.
Calling tests winners based on early lift. The first week of any test tends to be noisy. Wait for the minimum sample.
Optimising for the wrong metric. A test that increases add-to-cart but decreases checkout completion is net negative. Track the full funnel.
Big bang redesigns. Replacing the entire site at once eliminates the ability to attribute changes to specific elements. Small, isolated tests build a library of learnings.
What to expect
Realistic timelines and impact:
Month 1 to 3: Implement easy wins. Cumulative conversion rate improvement of 8 to 18 percent over baseline.
Month 4 to 6: Medium effort tests. Additional 5 to 15 percent improvement.
Month 7 to 12: Investment tests. Additional 8 to 15 percent improvement. Total CRO impact of 25 to 50 percent versus starting baseline.
Beyond the obvious tests, ongoing testing of smaller elements (button colours, headline copy, image variants) produces incremental gains that compound. Top-quartile D2C brands run continuous testing programmes with 4 to 8 active tests at any time.